Abstract
A critical aspect of a high-quality continuum of patient care is health record documentation. Prediction of poor documentation of electronic health records (EHRs) will help identify physicians who may need early communication to ensure their compliance. Machine learning (ML), a subfield of artificial intelligence, can be used to predict which physicians are non-compliant with health record documentation in an effort to provide high- quality healthcare in the continuum of care and treatment.
Objectives
To employ artificial intelligence tools based on ML classifiers to predict which physicians are likely to be non-compliant with completion of health record documentation in the EHR system. Also, to identify factors affecting the completeness of EHR documentation.
Methods
The information from 90,007 discharged health records was obtained from the EHR system between January 2015 and August 2021, which included physician age, gender, department, and nationality; year of discharge; and patient insurance type. Several ML classifiers in Orange software were used to predict health record documentation completion. Random forest, K-nearest neighbor (KNN), support-vector machines (SVM), neural network, naïve Bayes, logistic regression and AdaBoost are the seven machine learning tools that were employed to test the data’s prediction performance. These classifiers were used to create the best-fit model to predict documentation completeness.
Results
The best-fit model was the random-forest classifier, with AUC = 0.891 and F1 and Recall score = 0.831. Attributes found to be contributing to EHR documentation compliance are year of patient discharge, physicians age group and the department, respectively.
Conclusion
We demonstrate that the random-forest classifier helps hospital management identify physicians who might not complete EHR documentation. This knowledge can be applied to early-intervention methods to ensure that physicians at risk of not completing EHRs become compliant in an effort to enhance documentation adherence for overall improved patient-care quality and continuum of healthcare.
Key words: Documentation, Electronic health record, Machine learning, Quality of patient care.
Introduction
Worldwide, electronic health records (EHRs) and the use of electronic documentation are preferred because they decrease errors. The aim of EHRs is to enhance the healthcare providers’ clinical documentation and decrease the possibility of poor documentation, thereby enhancing the quality and safety of patient care1. Inconsistency and discrepancy in inpatient health records affect the treatment provided to the patient2. Therefore, a critical aspect of a high-quality continuum of patient care is health record documentation.
Incomplete documentation of discharge notes affects the transfer of older patients from hospital to home care3. Moreover, effective communication of discharge documentation between healthcare providers improves patient outcomes and enhances healthcare provider satisfaction4. High rates of hospital readmissions are associated with incomplete discharge summaries5. Incomplete clinical documentation and delays in writing discharge summaries are associated with unplanned hospital readmissions6.
Machine learning (ML) is a part of artificial intelligence whereby computers use a large set of data to identify the relationships between variables by computing algorithms7,8. It is an automated method to analyze data in which algorithms are used to develop models to predict an output variable based on input variables.
ML models have been applied to a variety of medical problems to discover new patterns in existing data9. It has been used to predict radiation pneumonitis in lung cancer patients10, the hospital length of stay at the time of admission11 and surgical site infection after neurosurgical operations12. Moreover, ML has been used to predict readmissions for heart failure patients13 and the amputation rate for patients with diabetic foot ulcers14.
The development of accurate prediction models depends greatly on the presence of complete documentation in patients’ EHR15. ML models were used to identify opioid misuse and heroin use (OM) patients from paramedic trip notes16. They have also been used to detect the keywords “naloxone,” “heroin,” and both combined to identify the true cases of OM. It was also used to predict the documentation of serious illness based on physician notes within 48 hours of intensive care unit admissions for seriously ill patients17.
Currently, the use of ML to assess predictive results in relation to health record documentation completion is rare: few researchers have evaluated ML and health record documentation in relation to specific variables18.
Some physicians are not compliant in completing health record documentation, and hospitals may or may not have policies in place to ensure completion of such records. In this study, we employed ML to help hospital decision makers improve documentation compliance to enable physicians to comply with system health record documentation. We focused on creating a prediction model using ML classifiers to predict which physicians will not complete EHR documentation in the system.
In the hospital understudy, when a patient is admitted to the hospital, the hospital staff completes admission documentation, which includes administrative and clinical information. A physician determines whether the patient is ready for discharge and if so, will complete the admission and discharge documentation in the EHR system. The current problem is in completing the final diagnosis in admission and discharge documentation (Figure 1). This is considered one of the main pieces of documentation that the physician needs to complete. Incomplete documentation impacts continued health support of patients and might affect their safety. Also, it impacts hospitals’ accreditation status because it is one of the accreditation standards.
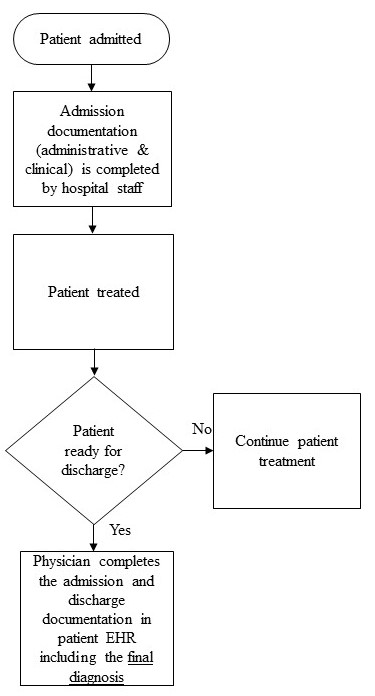
Figure 1. Workflow model for documentation process (current problem).
Material and Methods
Study location and parameters
This study is an experimental study that was conducted at a government hospital in Dammam City, Saudi Arabia. The data included one target variable, the completion of the electronic health record documentation, with two values (1,0) as well as six additional variables: clinical department; the physician’s gender, age, and nationality; the year of discharge; and the patient’s insurance type (Table 1).
Table 1. Health record documentation completion variables extracted to build the models.
|
Feature
|
Value
|
Data Type
|
Number of Category
|
|
Health record documentation completion
|
1= Complete
0= Incomplete
|
Categorical
|
2
|
|
Department
|
Department name
|
Categorical
|
33
|
|
Age
|
Age group of the physicians
(30-39, 40-49, 50-59, >60)
|
Categorical
|
4
|
|
Gender
|
Male, female
|
Categorical
|
2
|
|
Nationality
|
Saudi, Syrian, Egypt, French, Greece, Indian, Jordan, Other Asian, Pakistan, Sudanese.
|
Categorical
|
10
|
|
Year of Discharge
|
2015, 2016,2017, 2018, 2019, 2020, 2021.
|
Categorical
|
7
|
|
Patient insurance type
|
Governmental, private
|
Categorical
|
2
|
Ethical statement
Human subject research was conducted with approval from the governmental hospital’s Institutional Review Board, approval number H- 05- D- 107. The Institutional Review Board at Imam Abdulrahman bin Faisal University also approved the study on November 10, 2021, approval number IRB-PGS-2021-03-422. No consent was required because we aimed to develop a prediction model based only on physicians’ variables.
Analysis
The software used in this data analysis was Orange, which is component-based visual-programming software for data visualization, ML, data mining and data analysis. The first step was retrieving the data for all patients who were discharged during the last seven years, from 2015 to 2021, and extracting it to an Excel sheet.
Rank feature in Orange software was used to demonstrate the most contributing factors to the clinical documentation completion.
The project methodology included several steps: data pre-processing, model development and model evaluation.
Data pre-processing
The data for all discharged patients was extracted from the hospital’s health information system database to an Excel sheet. Patients discharged from January 2015 to August 2021 were included in the study. The data included 106,246 samples, which included 16,239 duplicate values. The duplicates were eventually removed using the “remove duplicates” tool in Excel, so the final data analyzed included 90,007 samples. The data included one target variable, the completion of the EHR documentation, with two values (1, 0) as well as six additional variables: clinical department; the physician’s gender, age, and nationality; the year of discharge and the patient’s insurance type (Table 1).
Developing the learning models
Orange version V3.31.1 was used to build the prediction model. Descriptive statistics for the study features were analyzed using IBM SPSS software version 28.0.1.1 (14). To develop the predictive models, seven classifiers in Orange software were used: random forest, KNN, AdaBoost, neural network, naïve Bayes, logistic regression and SVM.
The random-forest classifier produces a set of decision trees. Every tree is created from a small sample from the training data. When the classifier makes an individual tree, a random subset of attributes is drawn, and then the best attribute is selected19. KNN uses an algorithm to discover the closest training examples in features and uses the average to form the prediction20. AdaBoost is an algorithm that combines weak learners randomly selected from the dataset to make a strong learner19. Neural network is an ML model derived from the human brain. A typical neural network has an input layer, hidden layers and an output layer with different weights between layers and nodes21. Naïve Bayes is based on the Bayes theorem, in which the variables are assumed to be independent. It is a probabilistic classifier that calculates each variable independently against the target class20. Logistic regression is a regression analysis that can be used when the target variable is binary19. SVM is a kernel-based supervised learning algorithm that classifies the data into two or more classes. It is particularly designed for binary classification22. Table 2 presents a brief description of the various classifiers used in this study with their advantages and disadvantages.
Table 2. Classifiers brief description and their advantages and disadvantages.
|
#
|
Classifiers
|
Brief description
|
Advantages
|
Disadvantages
|
|
1
|
Random Forest
|
Random Forest classifier produces a set of decision trees. Every tree is created from a small sample from the training data. When the classifier makes an individual tree, a random subset of attributes is drawn then the best attribute is selected.
|
- Used to solve both classification as well as regression problems
- Less training time with high accuracy
- Efficient in handling non-linear parameters
|
- Complex
- Change greatly with small change in data
|
|
2
|
Neural Network
|
Neural Network is a machine learning model derived from the human brain. A typical neural network has an input layer, hidden layers, and an output layer with different weights between layers and nodes.
|
- Strong in representing complex data
- Good presenting nonlinear relationships between input and output features
|
- Complex
- Data dependant
|
|
3
|
AdaBoost
|
AdaBoost is an algorithm that combines weak learners randomly from the dataset to make a strong learner.
|
- Simple to implement
- Handle both text and numeric data
- Reduces bias and variance
|
- Sensitive to missing values and outliers
- Exposed to noisy data When weak classifier underperforms, the whole model may fail
|
|
4
|
KNN
|
KNN K- Nearest Neighbour uses an algorithm to discover the closest training examples in features and uses the average to form the prediction.
|
- No training period
- Very easy to implement
- New data can be added seamlessly which will not impact the accuracy of the algorithm
|
- Does not work well with large dataset
- Sensitive to missing values and outliers
|
|
5
|
SVM
|
SVM support-vector machine is a kernel-based supervised learning algorithm that classifies the data into two or more classes. SVM is particularly designed for binary classification.
|
- Handles non-linear data efficiently
- Used to solve both classification as well as regression problems
|
- Long training time
- Difficult to interpret
|
|
6
|
Logistic Regression
|
Logistic Regression is a regression analysis that can be used when the target variable is binary.
|
- Easy to use
- Simple to implement
- Perfect fitting on linearly separable datasets
- Overfitting can be reduced by regularization
|
- Effected by outliers
- Boundaries are linear
- Assumes the data is independent
|
|
7
|
Naïve Bayes
|
Naïve Bayes is based on Bayes Theorem, where the variables are assumed to be independent. It is a probabilistic classifier that calculates each variable independently against the target class.
|
- Used small amount of training data
- Training time is less
- Easy to implement
- Mainly targets the text
|
- Does not take into account the number of occurrences of each data.
- Assumes that all predictors are independent
|
Model Evaluation
Model evaluation is an important phase in model development. It explains how well a given classifier is performing. In our data, the target variable was slightly imbalanced, with 60.76 percent for complete documentation and 39.23 percent for incomplete documentation.
Stratified five-folds was used in cross-validation because it is the default parameter shown in Orange. The confusion matrix allows for the identification of misclassified cases or those that are truly classified. With the test and score feature in Orange, the classifiers were evaluated for prediction performance through cross-validation and the area under curve (AUC) score because the accuracy was compared across all classifiers. Performance metrics included AUC as a measurement of the classifier’s ability to distinguish between classes. Higher AUC scores indicate better classifier ability to distinguish between true positives and true negatives. Classification accuracy (CA) is the number of correctly predicted values divided by the number of predictions made: Accuracy = (TN+TP) / (TP+FP+TN+FN). Recall returns the proportion of positive values correctly predicted, which is used to calculate the true positive rate: Recall= TP / (TP + FN). On the other hand, the false-positive rate = FP / (TN + FP). Specificity returns the proportion of negative values correctly predicted: Specificity = TN / (TN + FP). In addition, precision returns the true positives among all the values predicted to be positive: Precision = TP / (TP + FP). Finally, the F1 score is the harmonic mean of precision and recall. It is often used to compare classifiers. F1 score = (2 × Precision × Recall) / (Precision + Recall).
Results
The dataset of 90,007 discharged health records showed 60.8 percent of the final diagnoses in form A were completed and 39.2 percent were not. Male physicians discharged 83.7 percent of the discharged health records, 73.2 percent of the physicians were Saudis, and 59.7 percent were between the ages of 50 and 59. The internal-medicine department had the most discharges, with 22.0 percent. Also, the most discharges occurred in 2019, with 16.2 percent. Most of the discharged patients, 90.1 percent, were on government insurance (Table 3).
Table 3. Result of the descriptive statistics of the study variables.
|
|
Variable
|
Frequency
|
Percent (%)
|
|
Health record documentation completion
|
0
|
35316
|
39.2
|
|
|
1
|
54691
|
60.8
|
|
Gender
|
Female
|
14710
|
16.3
|
|
|
Male
|
75297
|
83.7
|
|
Nationality
|
Egypt
|
8043
|
8.9
|
|
|
French
|
1049
|
1.2
|
|
|
Greece
|
1028
|
1.1
|
|
|
Indian
|
1012
|
1.1
|
|
|